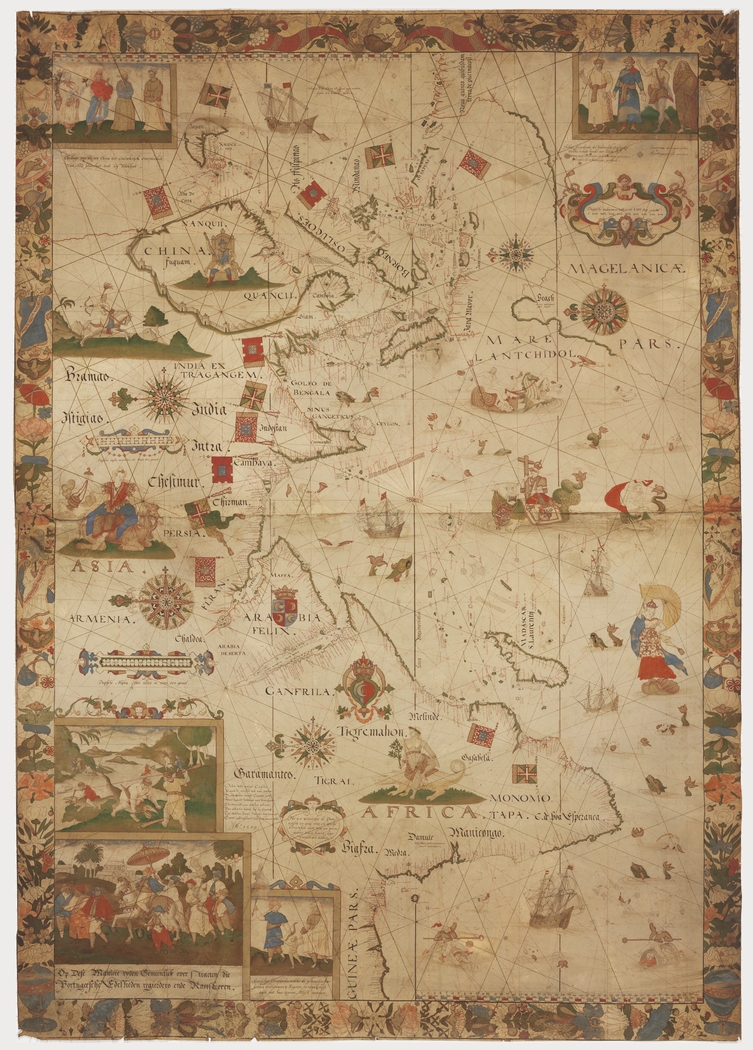
A Map of Africa, Asia and the East Indies, 1599, by Evert Gijsbertsz
Throughout the late sixteenth and seventeenth centuries decorated wall charts, similar to this manuscript chart by Evert Gijsbertsz, were found in the homes of rich merchants and statesmen across Europe. These charts documented recent discoveries and expeditions, served as planning tools for future trading ventures, and attested to the wealth and power of their owners. Few wall charts are as beautifully illustrated as this example from 1599. According to Gunther Schilder, the Dutch expert on historical cartography, the chart is one of the earliest dated Dutch manuscript charts of the Indian Ocean.
A Map of Africa, Asia and the East Indies, 1599, by Evert Gijsbertsz
Chart maker, Evert Gijsbertsz, lived in Edam and was one of a small group of chart makers working outside Amsterdam before 1602. In 1602 the Dutch East India Company was established and Amsterdam became the centre of map production. The chart is created on vellum and includes countless illustrations, enhanced with gold. It covers the oceans and coastlines between Guinea in the West and Japan and New Guinea in the East. You need to tilt your head to the left when looking at the chart as East is placed at the top of the map. We know that Gijsbertsz created the chart as his signature and the date is included in a self - dedication located at the top of Africa.
The map is in the style of a ‘portolan’ chart. Portolon charts are navigational maps criss-crossed with rhumb lines rather than lines of longitude and latitude. Very few interior details are provided on a portolon chart but along the coastlines a series of towns and landmarks aid the navigator in estimating their location along the coastline.
Like many chart makers Gijsbertsz was an armchair geographer who based his maps on the accounts of others; the latest news from sailors and navigators and the rough notes included in log books and rutters. This 1599 wall chart also incorporates numerous references from contemporary artists and a best seller, Linschoten’s Itinerario. Jan Huyghen van Linschoten was a Dutch merchant who travelled extensively along the East Indies' regions under Portuguese influence and served as the Portuguese Viceroy's secretary in Goa between 1583 and 1588. In 1596 he published, Itinerario, which provided a detailed account of the Portuguese voyages to the East Indies, including a series of illustrations and maps.
The 55 mm wide border is decorated with flowers, plants, birds and heraldic shields. A scattering of ships and sea monsters fill the spaces across the oceans, warning sailors of the treacherous waters and unknown dangers lurking beyond the known world. In the top corners and to the bottom left are depictions of Chinese, Indian and Portuguese traders almost identical to images in Linschoten’s publication. At the bottom in the centre is a drawing of a tournament with a soldier on a barrel, a direct reference to the detail in a print by Pieter van der Heyden after Pieter Bruegel the Elder.
What does the chart tell us about contemporary knowledge of the Australian continent and the Great South Land? Java and the northern coast of New Guinea appear in the top right hand corner. Nearby is an area marked Megalanica pars (or the land of Magellan), an alternate name, along with Terra Australis, used for the hypothetical continent to the South and a reference to Portuguese explorer Ferdinand Magellan who set out from Spain in 1519 to discover a western sea route to the Spice Islands, discovered what is now known as the Strait of Magellan and became the first European to cross the Pacific Ocean.
This rare manuscript chart was acquired by Sir William Dixson from Angus & Robertson. In their early years, Angus & Robertson traded as antiquarian dealers and had purchased the chart from a Dutch dealer, Frederick Muller, in 1904. Frederick Muller was also the source for one of the Library’s other significant manuscript charts, the Tasman map, documenting Tasman’s first and second voyages in 1642 – 44.
Maggie Patton, Manager, Research and Discovery


